
Navigating the globe
The 3D map is the canvas your data is drawn on. You move around it with the mouse:
rotate — place the cursor on the globe, hold the left button down and move the mouse; release it once you reach the point of view you want
zoom — use the mouse wheel, or the Page Up and Page Down keys
SEAScope keeps the viewing state between launches: you find the globe where you left it, at the same location and altitude.
Knowing where you are
The view info, at the top of the window, gives three indications:
the longitude and latitude of the mouse cursor, in decimal degrees
the viewing altitude — the distance between the camera and the surface of the globe — in metres or kilometres
the scale, as an order of magnitude between pixels and geographical distances
Camera controls
Beside the drawing tools, the toolbar at the top left holds:
zoom in and zoom out
reset the viewing state, to come back to the initial location and altitude
aligned globe rotation, a toggle: switched on, the rotation is locked on the longitude / latitude axes; switched off, the globe rotates freely in any direction
the rasterization mode selector, which is where the different viewing modes live: F for full, W for wireframe and V for vertex
Working with layers
Two panels work together.
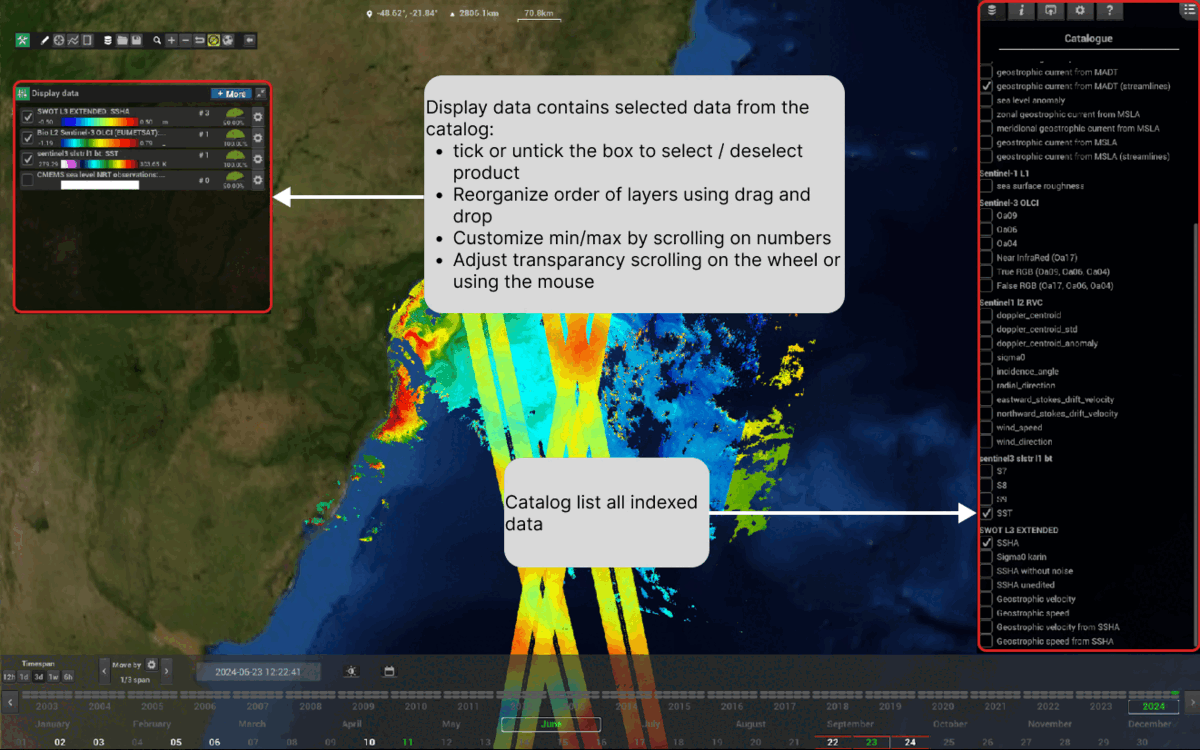
The Catalogue, on the right, lists all the data indexed in your data directory, grouped by collection. Tick a product there to add it to the view.
The Display data panel, on the left, contains the products you selected from the catalogue, and is where you control how they are drawn:
tick or untick the box to select or deselect a product
reorganise the order of the layers by drag and drop
customise the min and max values by scrolling on the numbers
adjust the transparency by scrolling on the wheel, or using the mouse
Rendering and colormaps
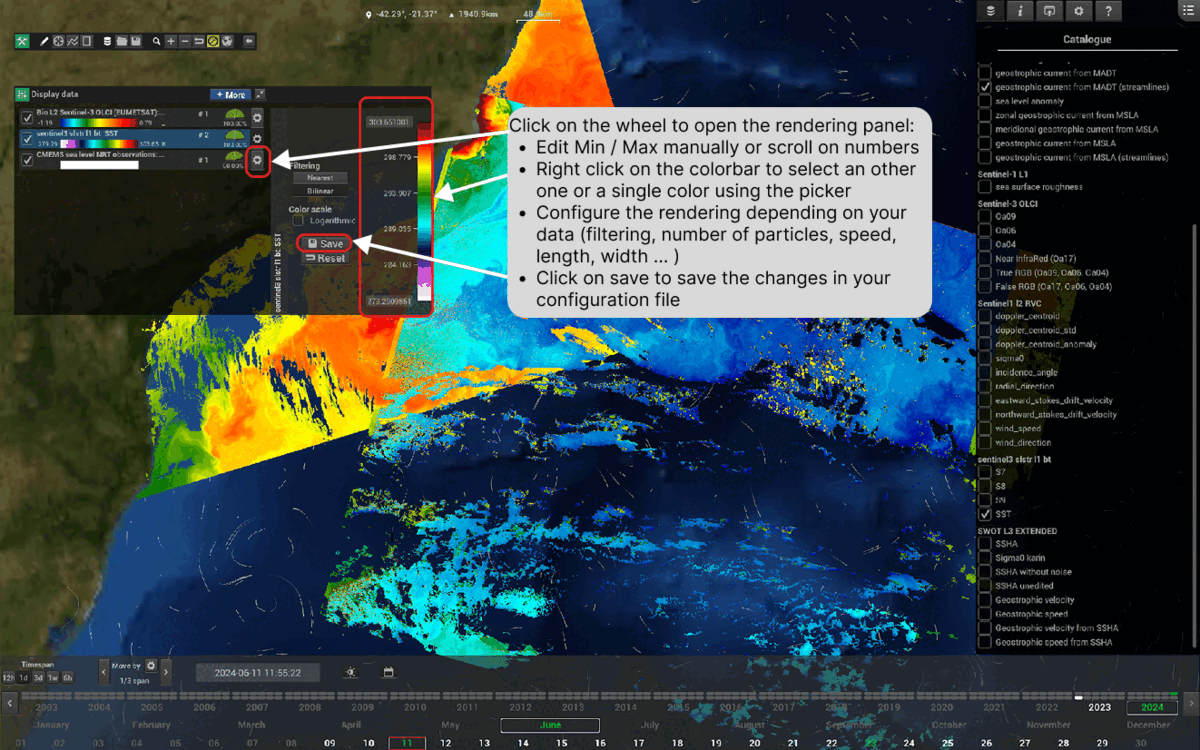
Click on the wheel of a layer, in the Display data panel, to open its rendering panel. From there you can:
edit the Min and Max manually, or scroll on the numbers
right click on the colorbar to pick another one, or a single colour with the colour picker
configure the rendering according to your data — the filtering applied, and for streamlines the number of particles, their speed, length and width
click on Save to write the changes into your configuration file
Time navigation
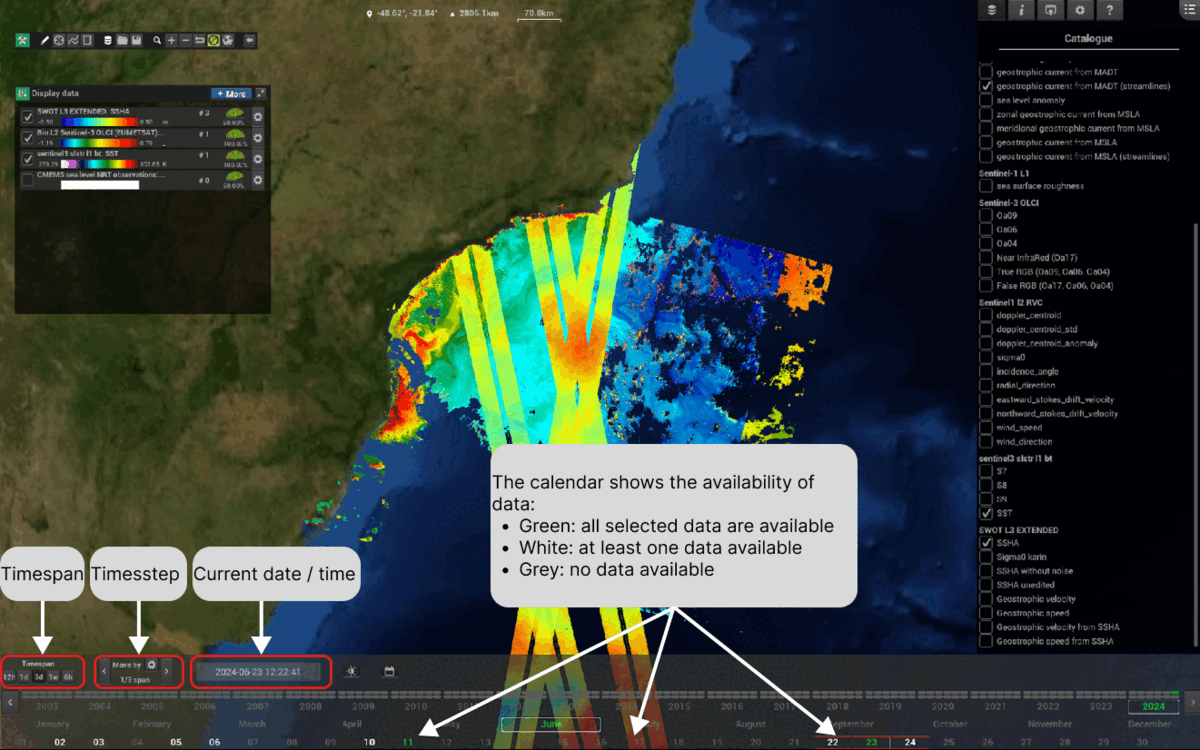
Three controls sit at the left end of the timeline:
Timespan — the width of the time window data is looked for in
Timestep — how far one step moves, as a fraction of the span
Current date / time — the instant being displayed
The calendar itself shows the availability of the data you selected:
green — all the selected data are available
white — at least one of the selected data is available
grey — no data available
Analysis tools
Extraction under a polygone